Health Charts
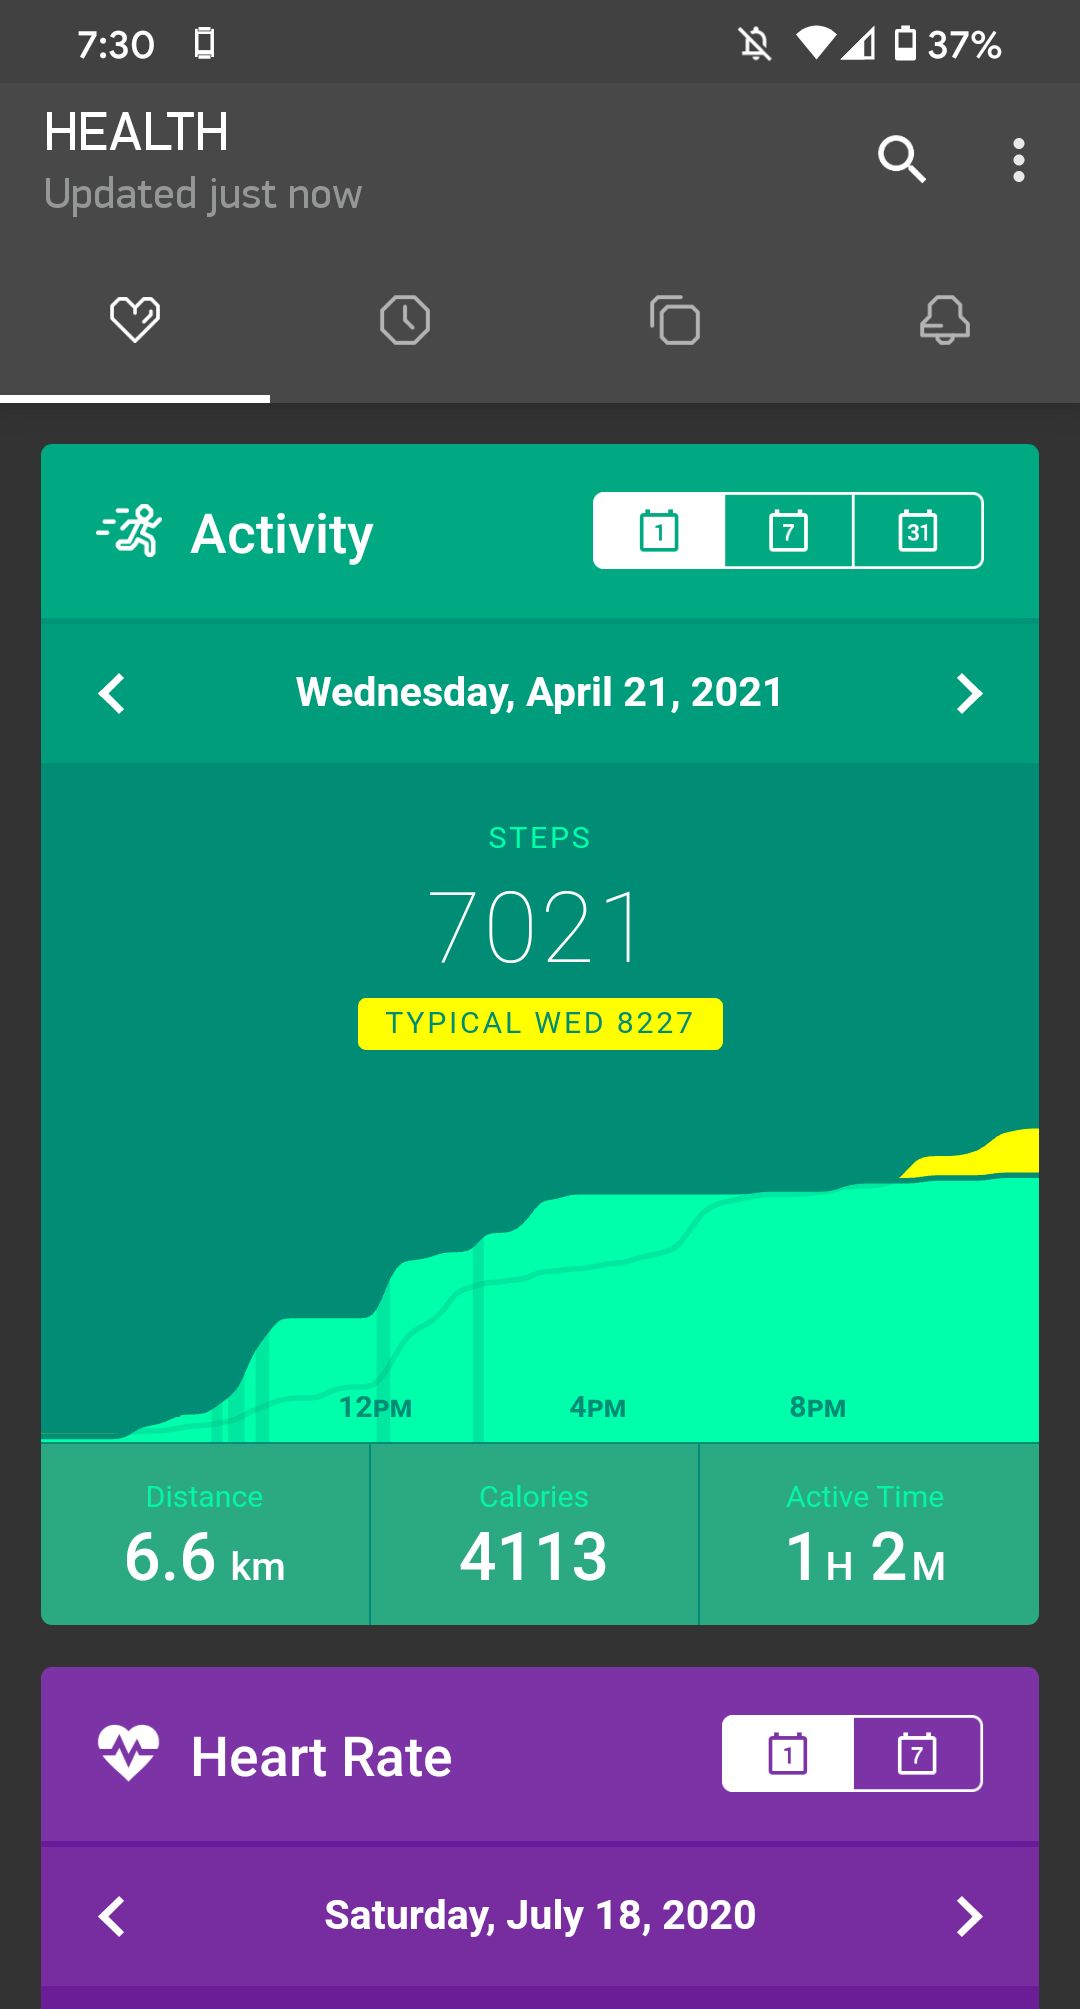
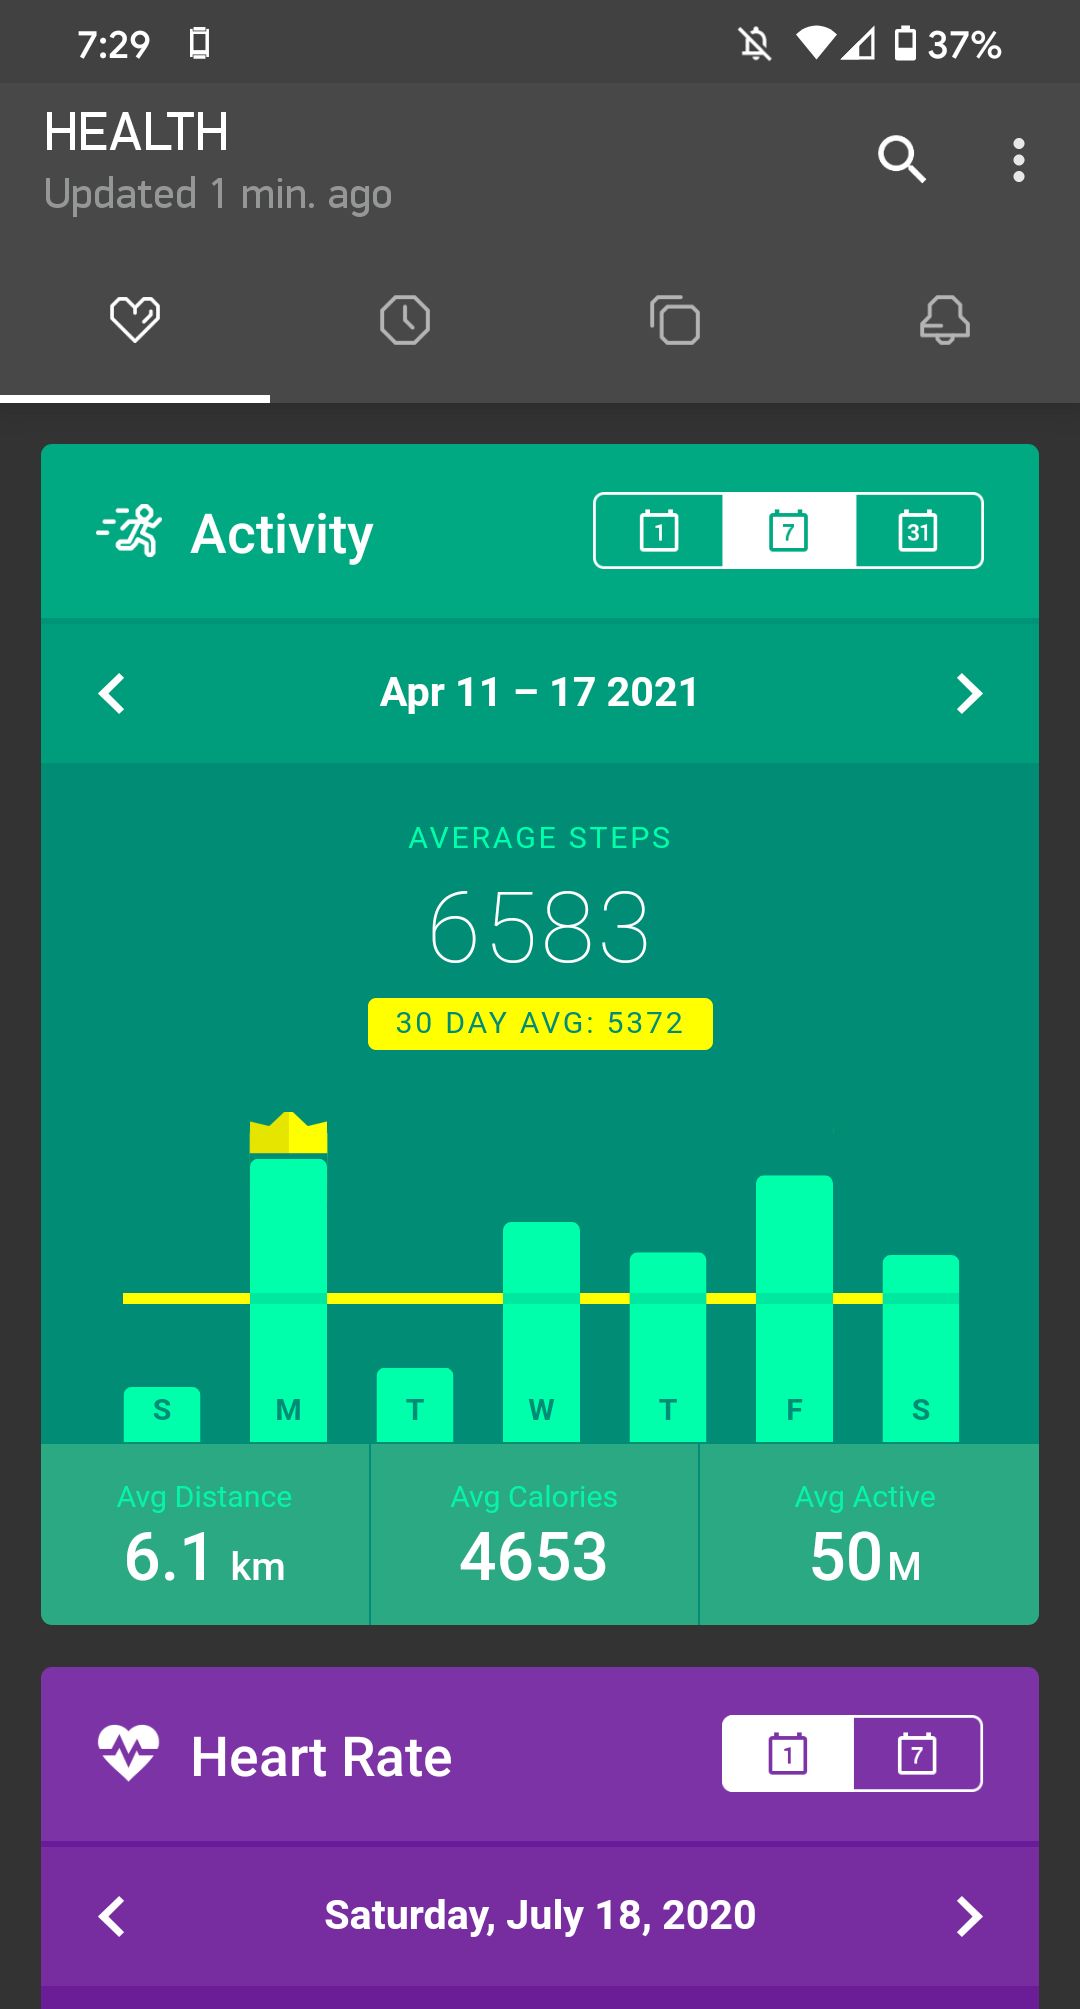
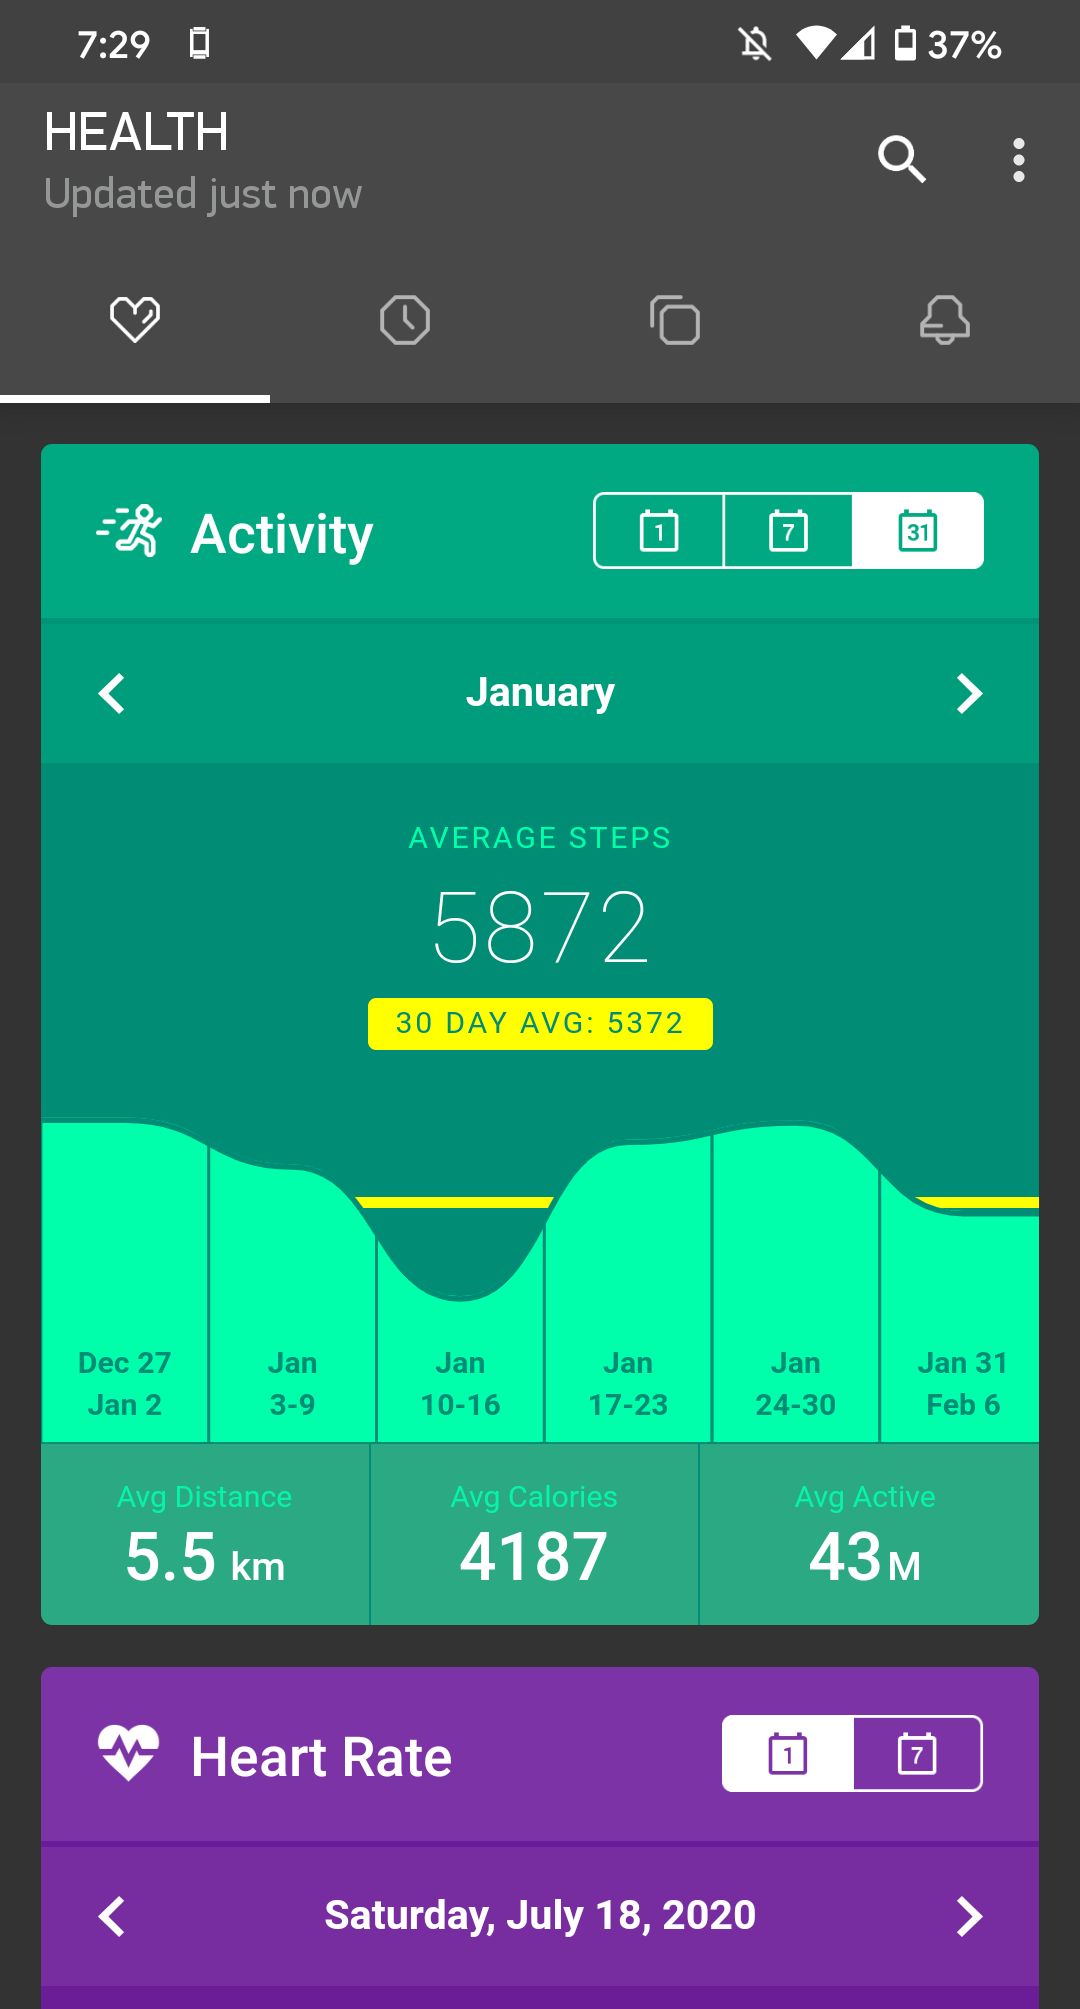
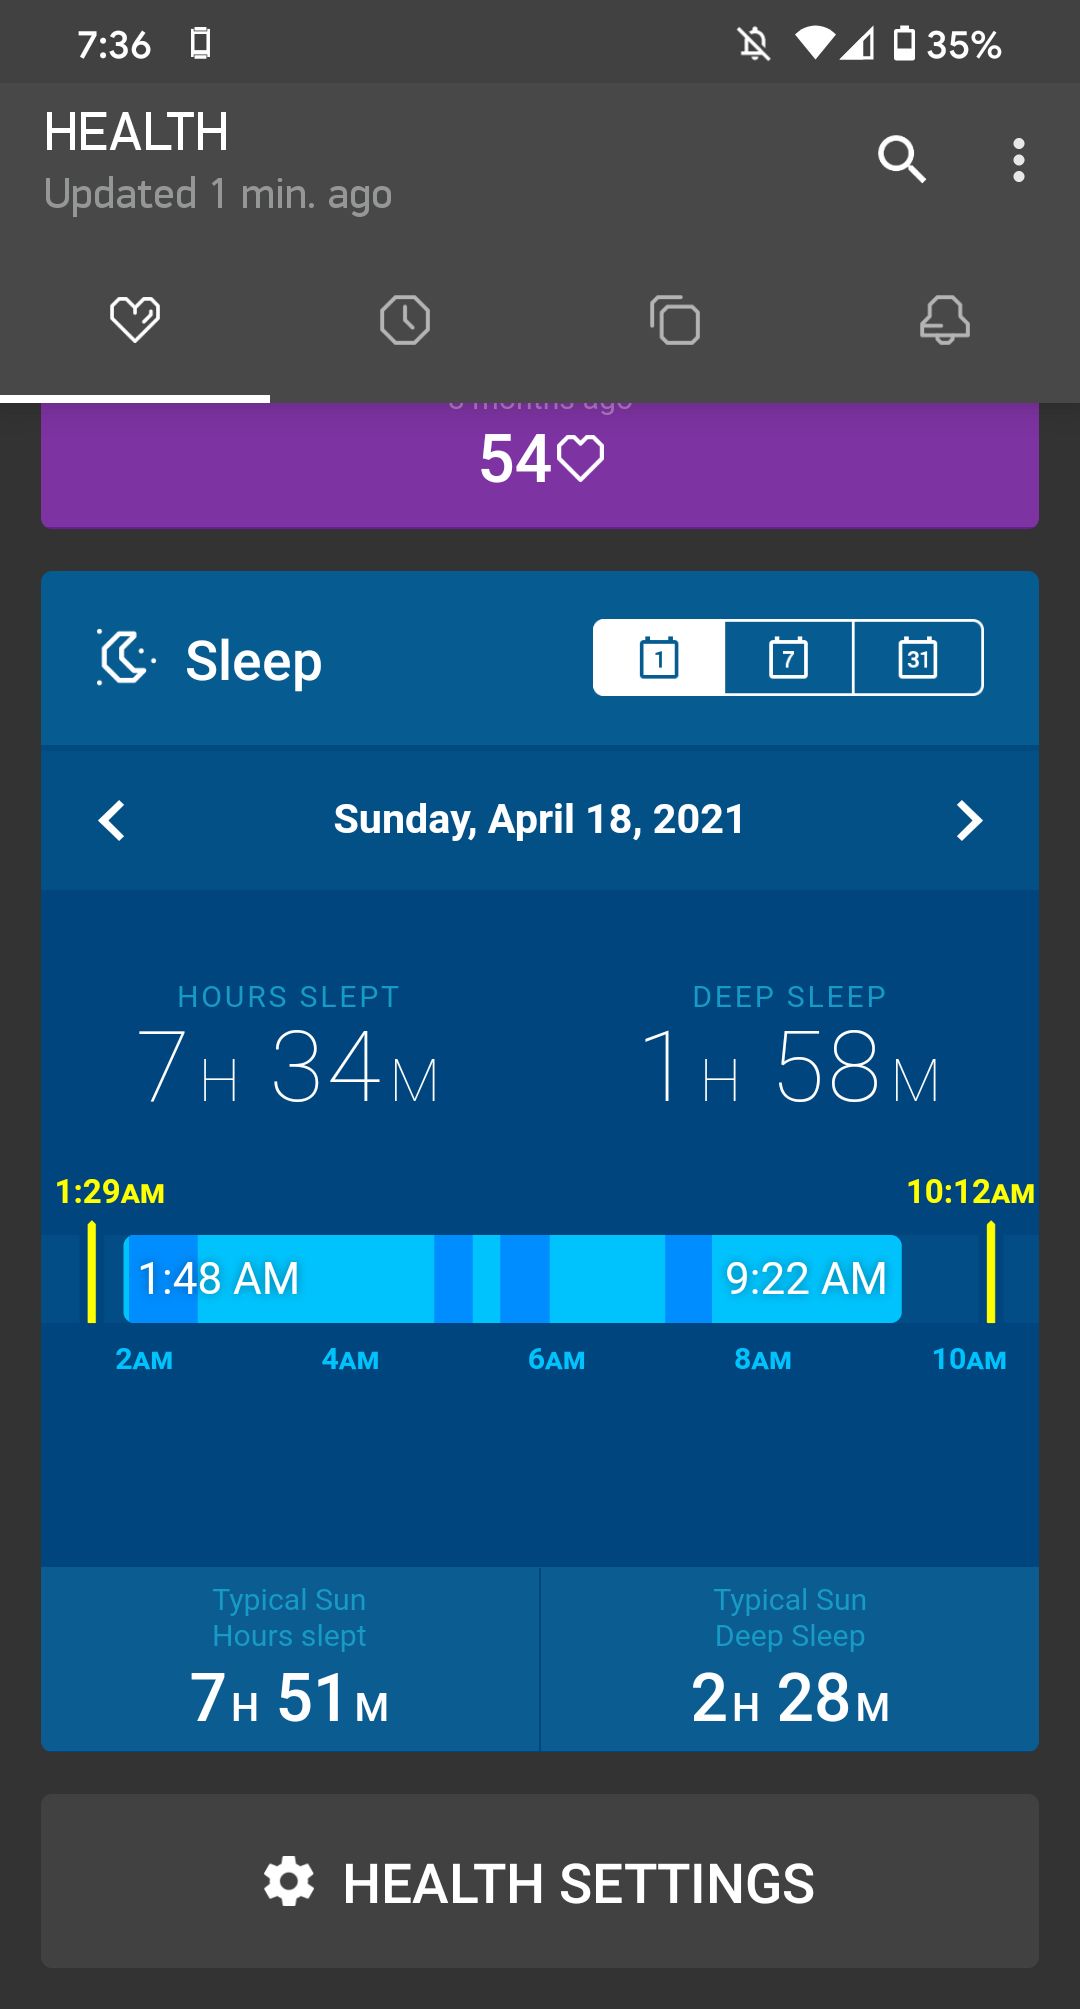
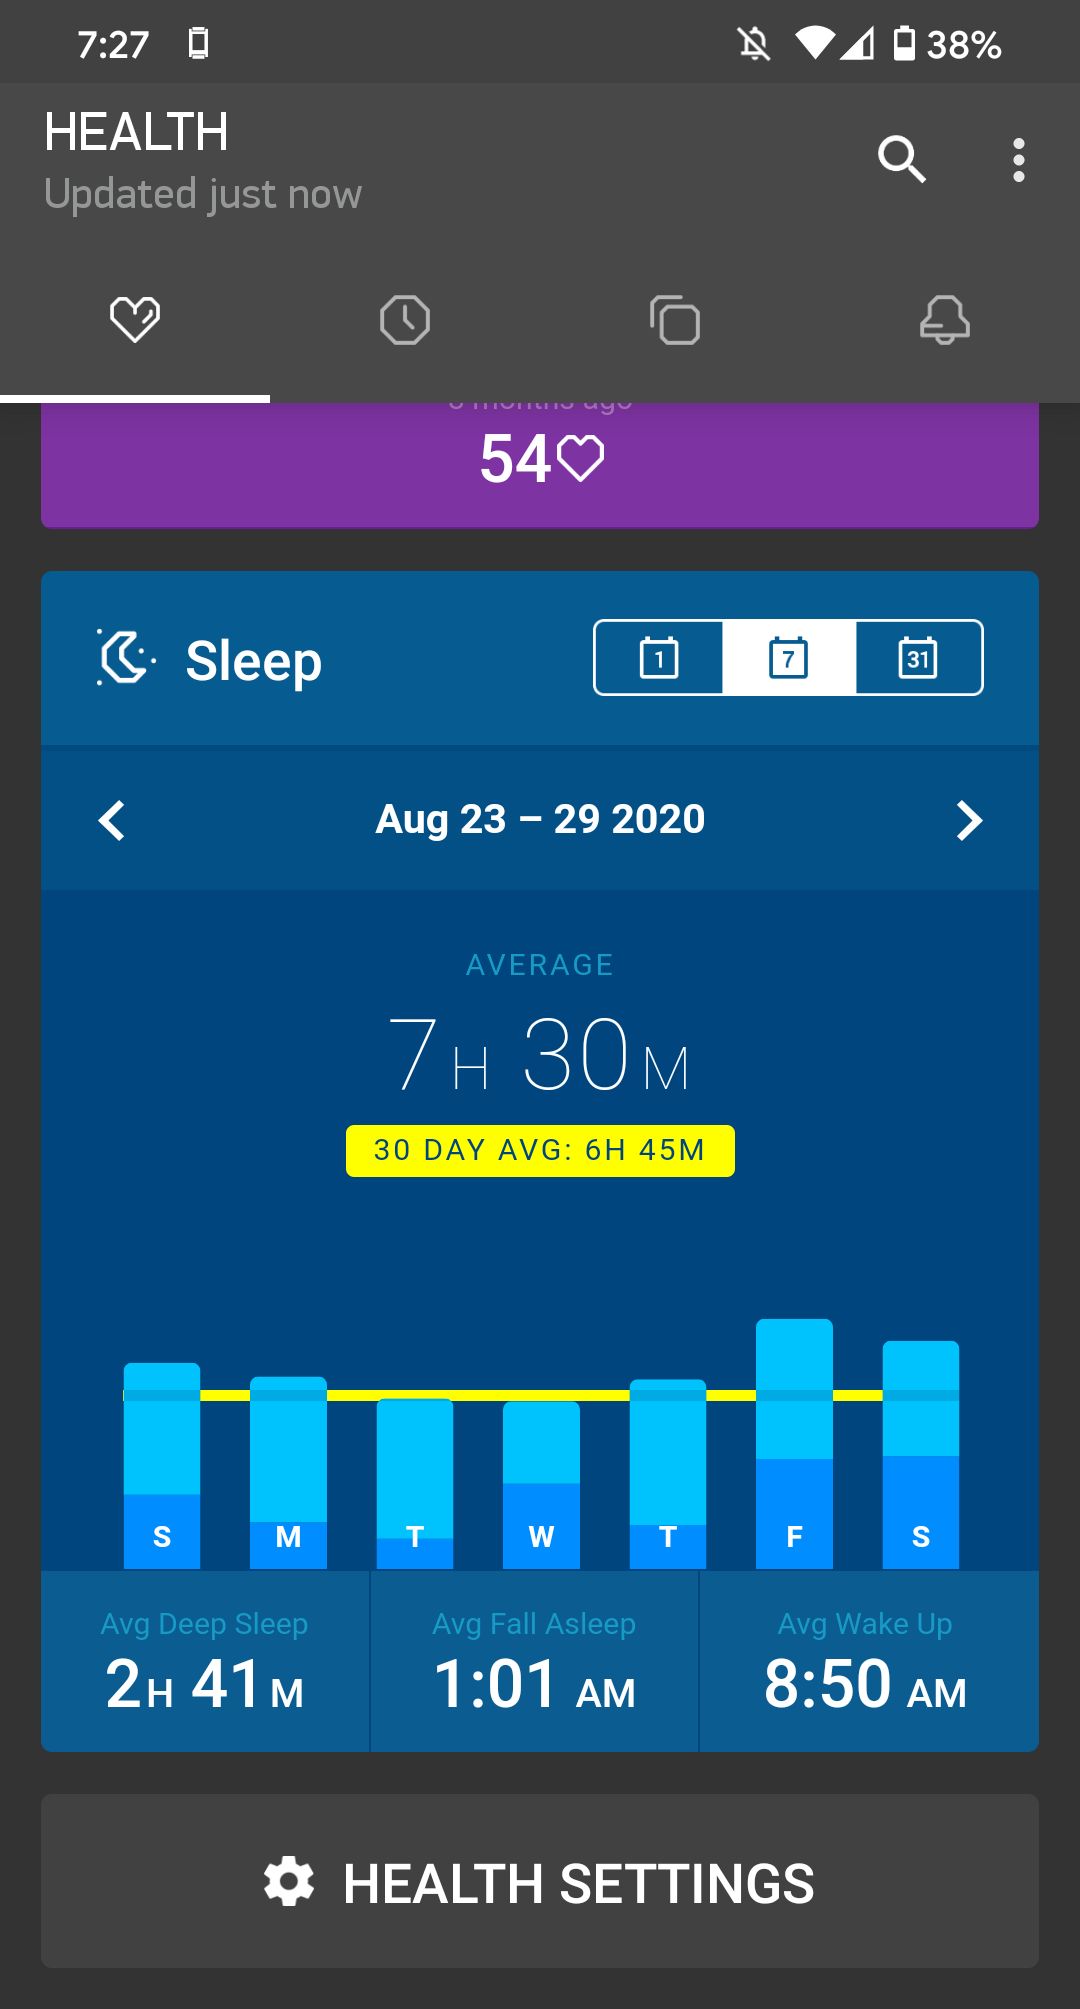
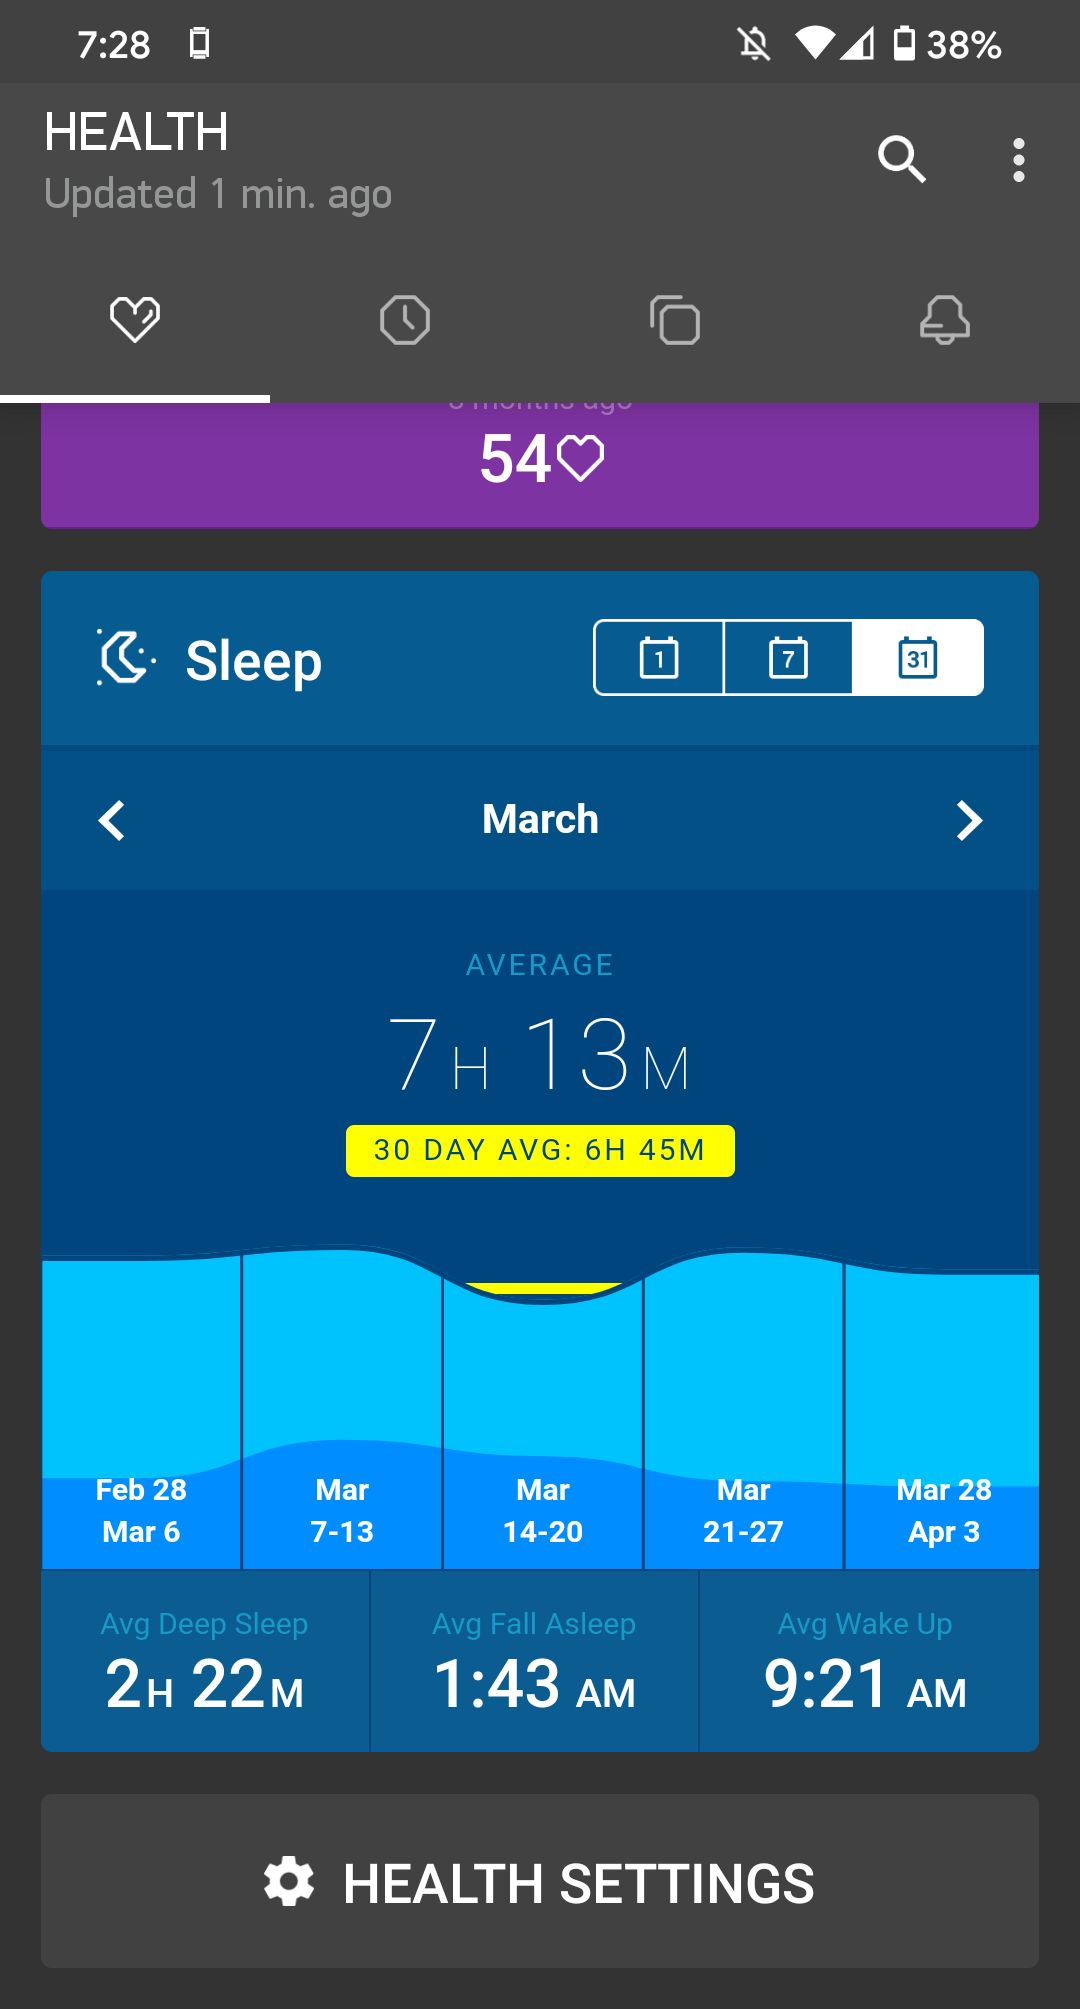
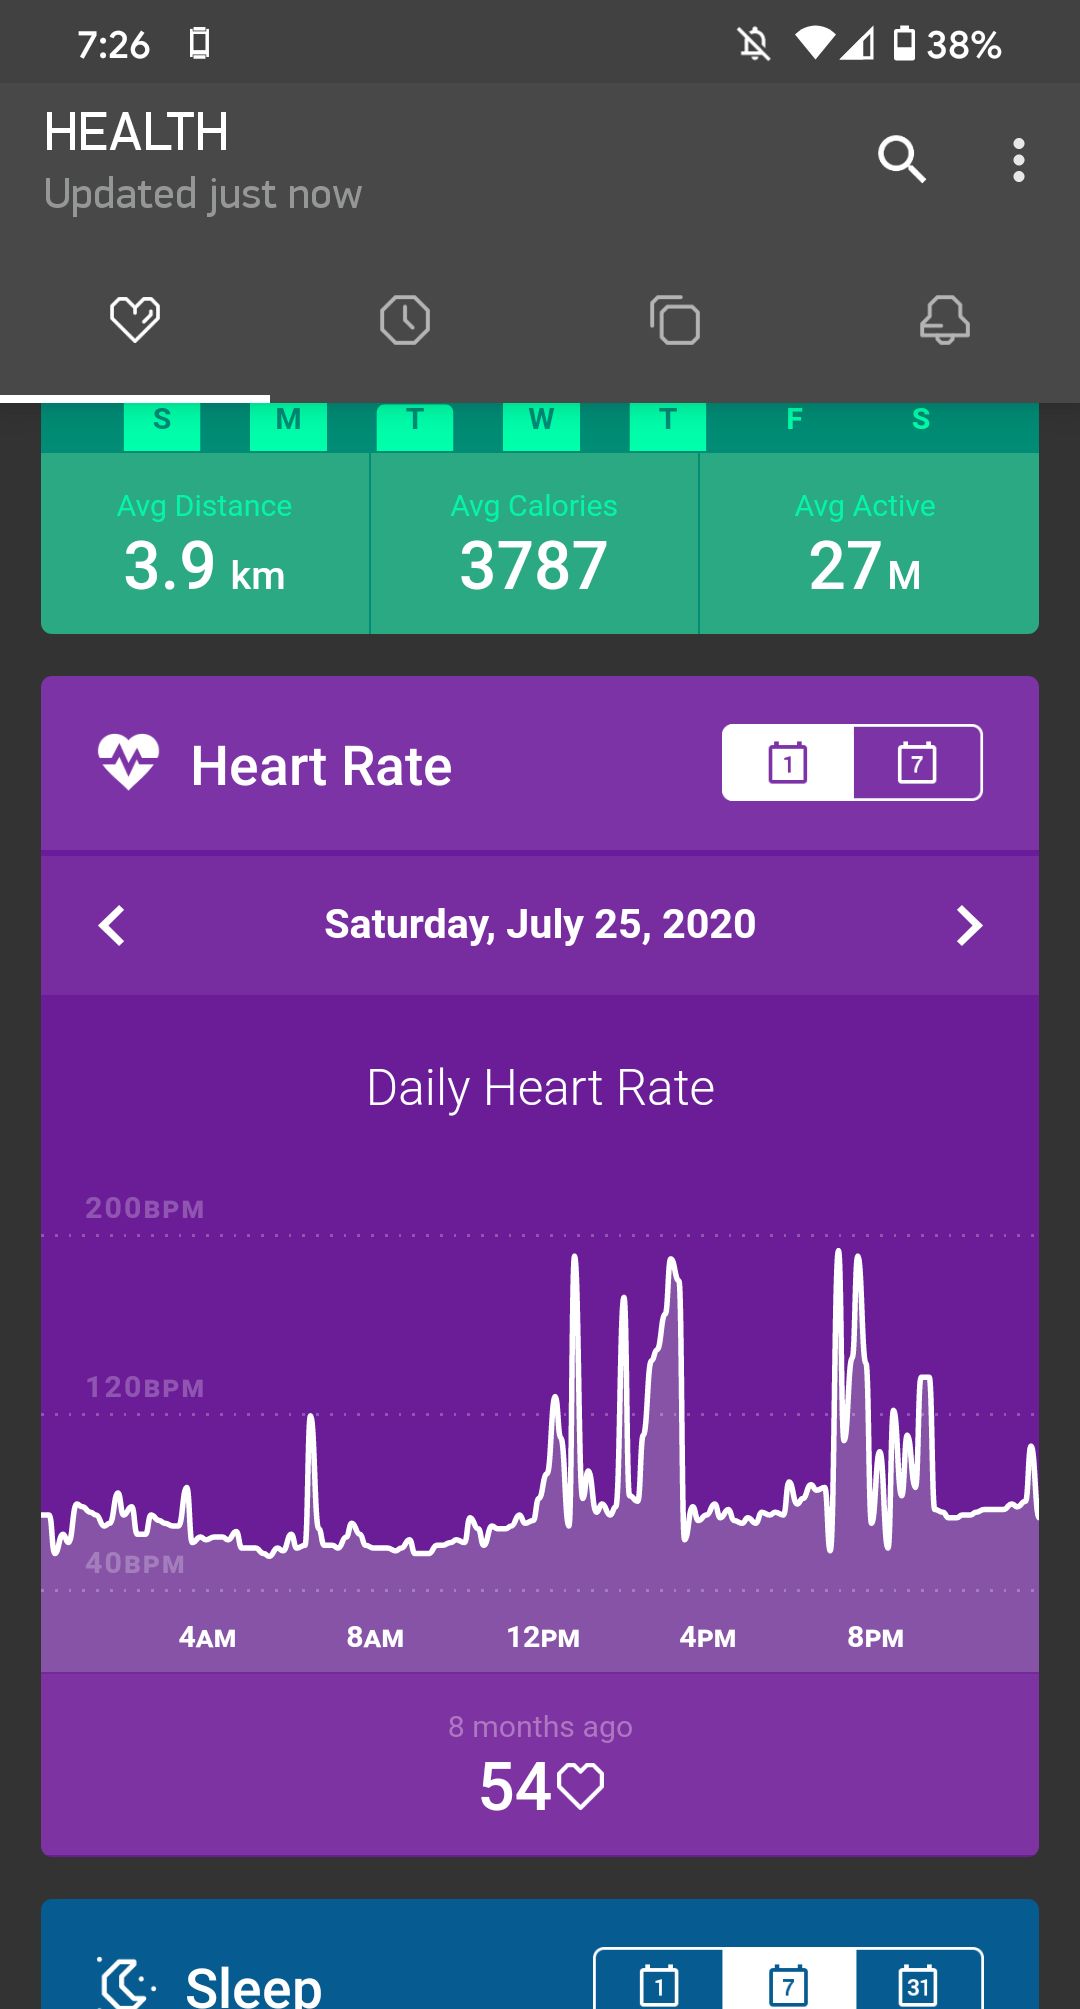
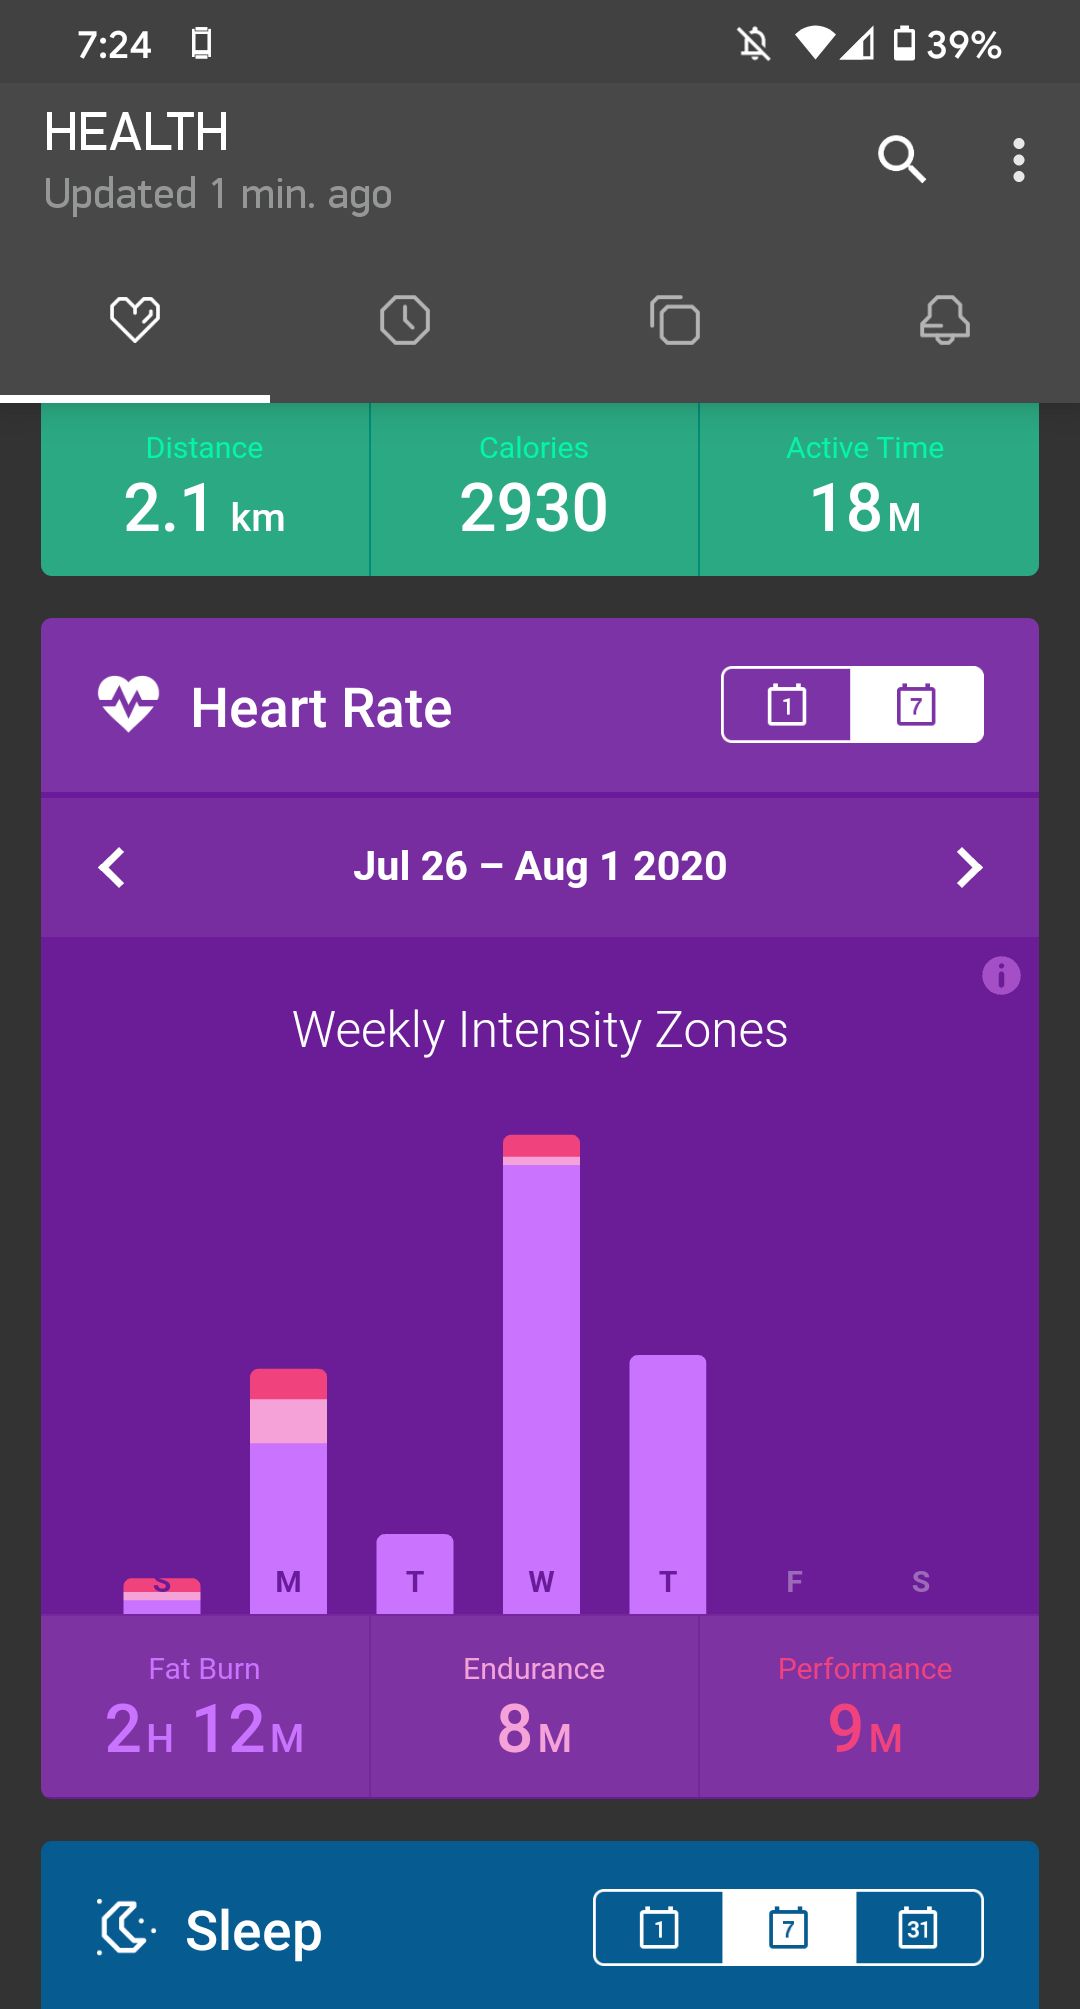
I was involved in many cross-disciplinary projects at Pebble. One of these were the health charts in the Pebble mobile app, which I brought to life working side by side with another engineer. These charts provided users a quick and easy way to track their health data including steps, sleep, and heart rate. We used D3.js to do most of the heavy lifting when it came to drawing and animating the graphs.
Technology
- D3.js
- HTML
- Sass
- Webpack
- Karma
![Screenshot of the daily steps graph.](/static/97dcc14ef4c7d1a6f01855d164645758/99596/pebble-health-steps-daily.jpg)
![Screenshot of the weekly steps graph.](/static/34979895d4fdcf1ce7743c985a45610a/99596/pebble-health-steps-weekly.jpg)
![Screenshot of the monthly steps graph.](/static/2739763f64b7fa055bf01f372c2a5367/99596/pebble-health-steps-monthly.jpg)
![Screenshot of the daily sleep graph.](/static/366fb9633eca13e11b8f210a699715fc/99596/pebble-health-sleep-daily.jpg)
![Screenshot of the weekly sleep graph.](/static/0993bef5dad1e69aea8e72a99a0f1ed4/99596/pebble-health-sleep-weekly.jpg)
![Screenshot of the monthly sleep graph.](/static/2137707b432c89307e532b1c04363014/99596/pebble-health-sleep-monthly.jpg)
![Screenshot of the daily heart rate graph.](/static/80803834a653e9d4ae52b59aa13a33cf/99596/pebble-health-hr-daily.jpg)
![Screenshot of the weekly heart rate graph.](/static/b649831a1d2547deda669dcc87855328/99596/pebble-health-hr-weekly.jpg)